
About Data & Analytics
A Data & Analytics course leads to careers like Data Analyst, Data Scientist, and BI Analyst, helping businesses make data-driven decisions. Industries such as finance, healthcare, and AI rely on these skills, offering high salaries and strong career growth. 🚀
Industry Professional Led Sessions
Get guidance from qualified industry professionals.
Project Portfolio
Start building a job-ready profile with a dynamic project portfolio
Career Assistance
Prepare for interviews with guidance and opportunities to showcase skills
Dedicated Peer Network
Build connections with like-minded learners to exchange ideas and experiences.
Learn Industry Skills
Fast-track your upskilling journey with industry skills and personalized guidance.
Certification
Attain your certificate upon course completion to showcase your capabilities.
Master these Tools
Master these Tools


Build Projects from Scratch
Build Projects from Scratch

Sales Forecasting Model
This project uses historical sales data to predict future sales trends. The final output is a dashboard or report that provides insights to help businesses optimize inventory, set revenue targets, and plan strategies effectively.
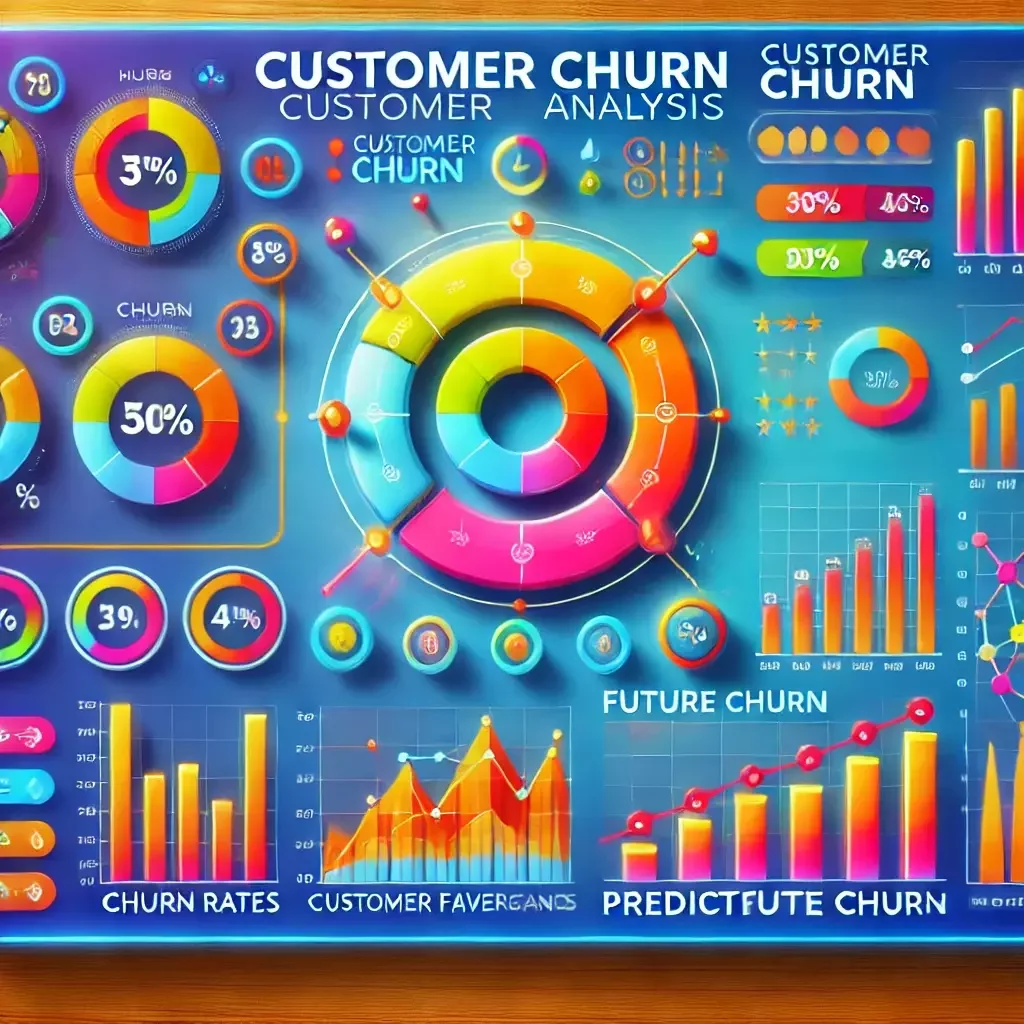
Customer Churn Analysis
Customer Churn Analysis
This project analyzes customer data to identify churn factors by examining transactions, support interactions, and feedback.

Real-time Stock Market Dashboard
Real-time Stock Market Dashboard
A project that tracks and visualizes live stock prices using financial data APIs. It features helping users make informed investment decisions in real-time.

E-commerce Product Recommendation System
E-commerce Product Recommendation System
A project that uses customer purchase history and product data to suggest personalized recommendations. It leverages machine learning algorithms to predict user preferences, enhancing the shopping experience and boosting sales.
Still Confused?

FAQs
♦What is data analytics?
It’s the process of examining data to uncover insights, trends, and patterns for better decision-making.
♦Why is data analytics important?
It helps businesses optimize operations, improve customer experiences, and drive strategic decisions.
♦What are the types of data analytics?
Descriptive (what happened), diagnostic (why it happened), predictive (what might happen), and prescriptive (what should be done).
♦Which tools are used in data analytics?
Popular tools include Excel, SQL, Python, R, Power BI, and Tableau.
♦What is the difference between data analysis and data analytics?
Data analysis focuses on interpreting data, while data analytics includes collecting, processing, and modeling data for insights.